Tip #512

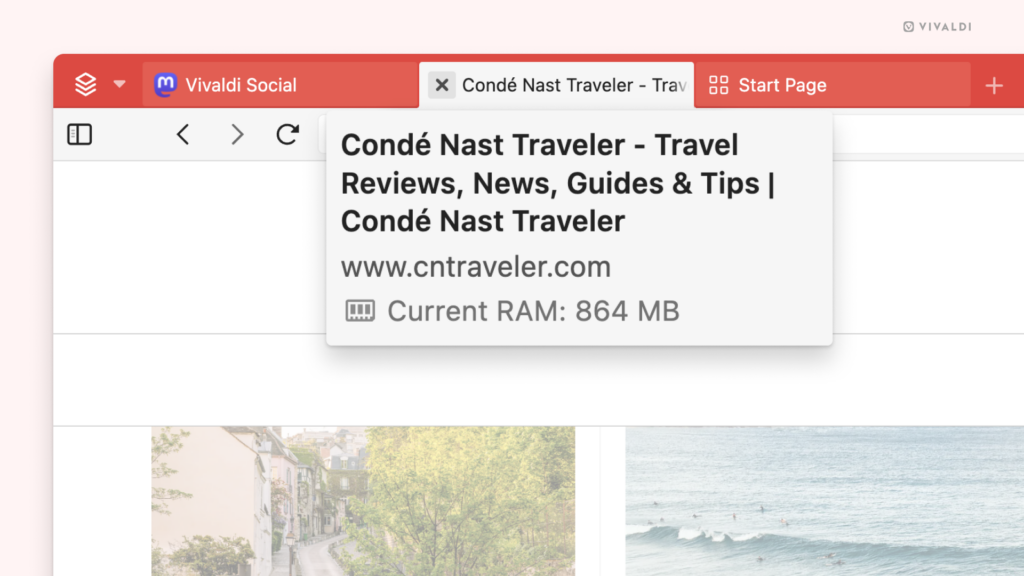
View tabs’ real-time memory usage from their thumbnail previews.

When you feel like the browser is getting a little sluggish, it’s likely that one or more of the tabs is using a lot of resources. In that case, it might be a good idea to close or at least hibernate the tab(s). To find the resource hogs, simply hover over a tab on the Tab Bar to view their memory usage.

If you don’t see Tab Thumbnails on hover, go to Settings > Tabs > Tab Display > Tab Options and make sure “Show Popup Thumbnails” has been enabled.

Active tab's tab thumbnail showing its current memory use.

Tip #486

Boost Vivaldi’s performance by enabling the Memory Saver.

Reduce memory usage by automatically hibernating tabs that haven’t been used in a while. This way, active tabs, such as those used for gaming or streaming, can run more smoothly.

To enable the Memory Saver:

  1. Go to Settings > Tabs > Memory Saver.
  2. Select your preferred option:
    • Disabled
    • Automatic (recommended)
    • After 1 Hour Idle
    • After 2 Hours Idle
    • After 3 Hours Idle
    • After 6 Hours Idle

Tip #207

Check the browser’s Task Manager to see how the resources being used are divided among processes.

Have you ever checked your operating system’s Task Manager and wished to get a more detailed overview of the memory use of one app or another? Luckily, in Vivaldi you can do just that.

To open Vivaldi’s own Task Manager, go to Tools > Task Manager in the main Vivaldi menu or use the Keyboard Shortcut Shift + Esc. There you can see the memory footprint, CPU usage and more for each tab, Web Panel, Extension, etc. and spot the culprit if the resource usage is abnormally high.

Vivaldi Browser's Task manager window.