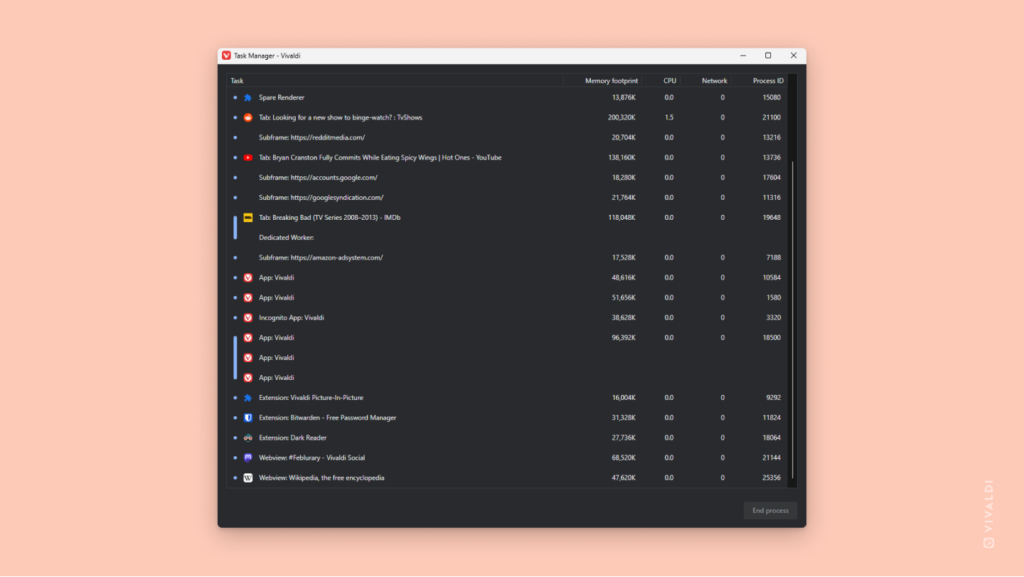
Check the browser’s Task Manager to see how the resources being used are divided among processes.
Have you ever checked your operating system’s Task Manager and wished to get a more detailed overview of the memory use of one app or another? Luckily, in Vivaldi you can do just that.
To open Vivaldi’s own Task Manager, go to Tools > Task Manager in the main Vivaldi menu or use the Keyboard Shortcut Shift + Esc. There you can see the memory footprint, CPU usage and more for each tab, Web Panel, Extension, etc. and spot the culprit if the resource usage is abnormally high.


